
The PREVGROUPVAL function in Salesforce is fortunately a little easier to understand than its sibling, PARENTGROUPVAL. If you haven’t read that article yet and don’t yet understand Summary Formulas yet, I recommend starting there for a primer and then coming back!
Basic PREVGROUPVAL Summary Formula (Previous Quarter’s Total Opportunity Amount)
We’ll start here with a report that simply demonstrates how the PREVGROUPVAL formula works, and then we’ll build off that to show something more interesting in useful. What we’re building here simply displays the total Opportunity amount from the previous Opportunity group.
Let’s start first with a very basic Opportunity Report, with a configuration something like this:

Columns: Account Name, Opportunity Name, Stage, Close Date, Amount
Then we’ll create a Summary Formula.
Click the Caret next to Columns, then click Add Summary Formula

Let’s add a new Summary Formula which looks like this:

Let’s name our column Previous Quarter Total, set the output type to Currency, and Decimal Points to 2.
For the Formula, just put the following code, then click Validate:
PREVGROUPVAL(AMOUNT:SUM, FISCAL_QUARTER)This sums the Amount field within the previous group, and then displays it.
When you try to hit Save or Validate, you’ll see a warning like this:

To fix this, go into the Display tab, set the formula to apply to Specific Groups, and then in this case, Row Group should automatically be set to Fiscal Period

Now we can click Apply.
Now let’s do one more thing before reviewing our work:

Go up to the Amount field, click the caret, hover over Summarize, and click Sum.
Now let’s take a look:

Notice how the the Previous Quarter Total field for Q1-2023 contains the same value as the Amount Subtotal for Q4-2022. Likewise the Previous Quarter Total field for Q4-2022 contains the same value as the Amount Subtotal for Q3-2022. This is how PREVGROUPVAL works: It allows us to compare our summary in the current grouping to a previous grouping in our report.
1 more thing to check out: You see that the Previous Quarter Total field for Q3-2022 is blank? That’s because there’s no previous group to compare against. Our report only contains data back to Q3-2022, so there’s no Q2-2022 to compare with.
How to Skip Groups
It’s not uncommon to need to skip groups when you’re summarizing data. Maybe you want to compare this fiscal quarter against the same one last year? Or the number of text messages sent each day versus the same day 1 week ago. Fortunately both of these use cases are supported, and pretty simply at that!
Let’s re-open the Previous Quarter Total summary formula again by double-clicking it, and we’ll make 1 small change:

See the change? We added a new parameter, and set the value 2:
PREVGROUPVAL(AMOUNT:SUM, FISCAL_QUARTER, 2)Go ahead and click Apply.

You can see now that Previous Quarter Total field for Q1-2023 now matches the Amount Subtotal for Q3-2022. It skipped Q4-2022 entirely! If we could fit Q2-2023 on-screen, we’d see it now reflecting the value in the Amount Subtotal for Q4-2022.
Additionally, notice that the values for Previous Quarter Total field for both Q3-2022 and Q4-2022 are blank. Once again there’s no data available to compare against, so the values are blank.
Basic PREVGROUPVAL Summary Formula (% Change in Amount by Quarter)
Let’s move on to something a little more useful. Let’s take compare opportunity amounts by quarter to see how they change:

We’ll first change the Column Name to something like % Change From Last Quarter, then change the Formula Output Type to Percent. Then we’ll enter this as our formula:
(
    AMOUNT:SUM - PREVGROUPVAL(AMOUNT:SUM, FISCAL_QUARTER)
) / PREVGROUPVAL(AMOUNT:SUM, FISCAL_QUARTER)
AMOUNT:SUM represents the current period’s total Amount
PREVGROUPVAL(AMOUNT:SUM, FISCAL_QUARTER) represents the previous period’s total Amount
So written more simply, we’re calculating the following:
(CURRENT_PERIOD_AMOUNT - LAST_PERIOD_AMOUNT) / LAST_PERIOD_AMOUNTThis should give us a result where from quarter to quarter, if the total mount increases, we see a positive value representing how much of an increase we see. Likewise if the total amount decreases from quarter to quarter, we should see a negative value representing how much the total amount went down.
Click Apply.

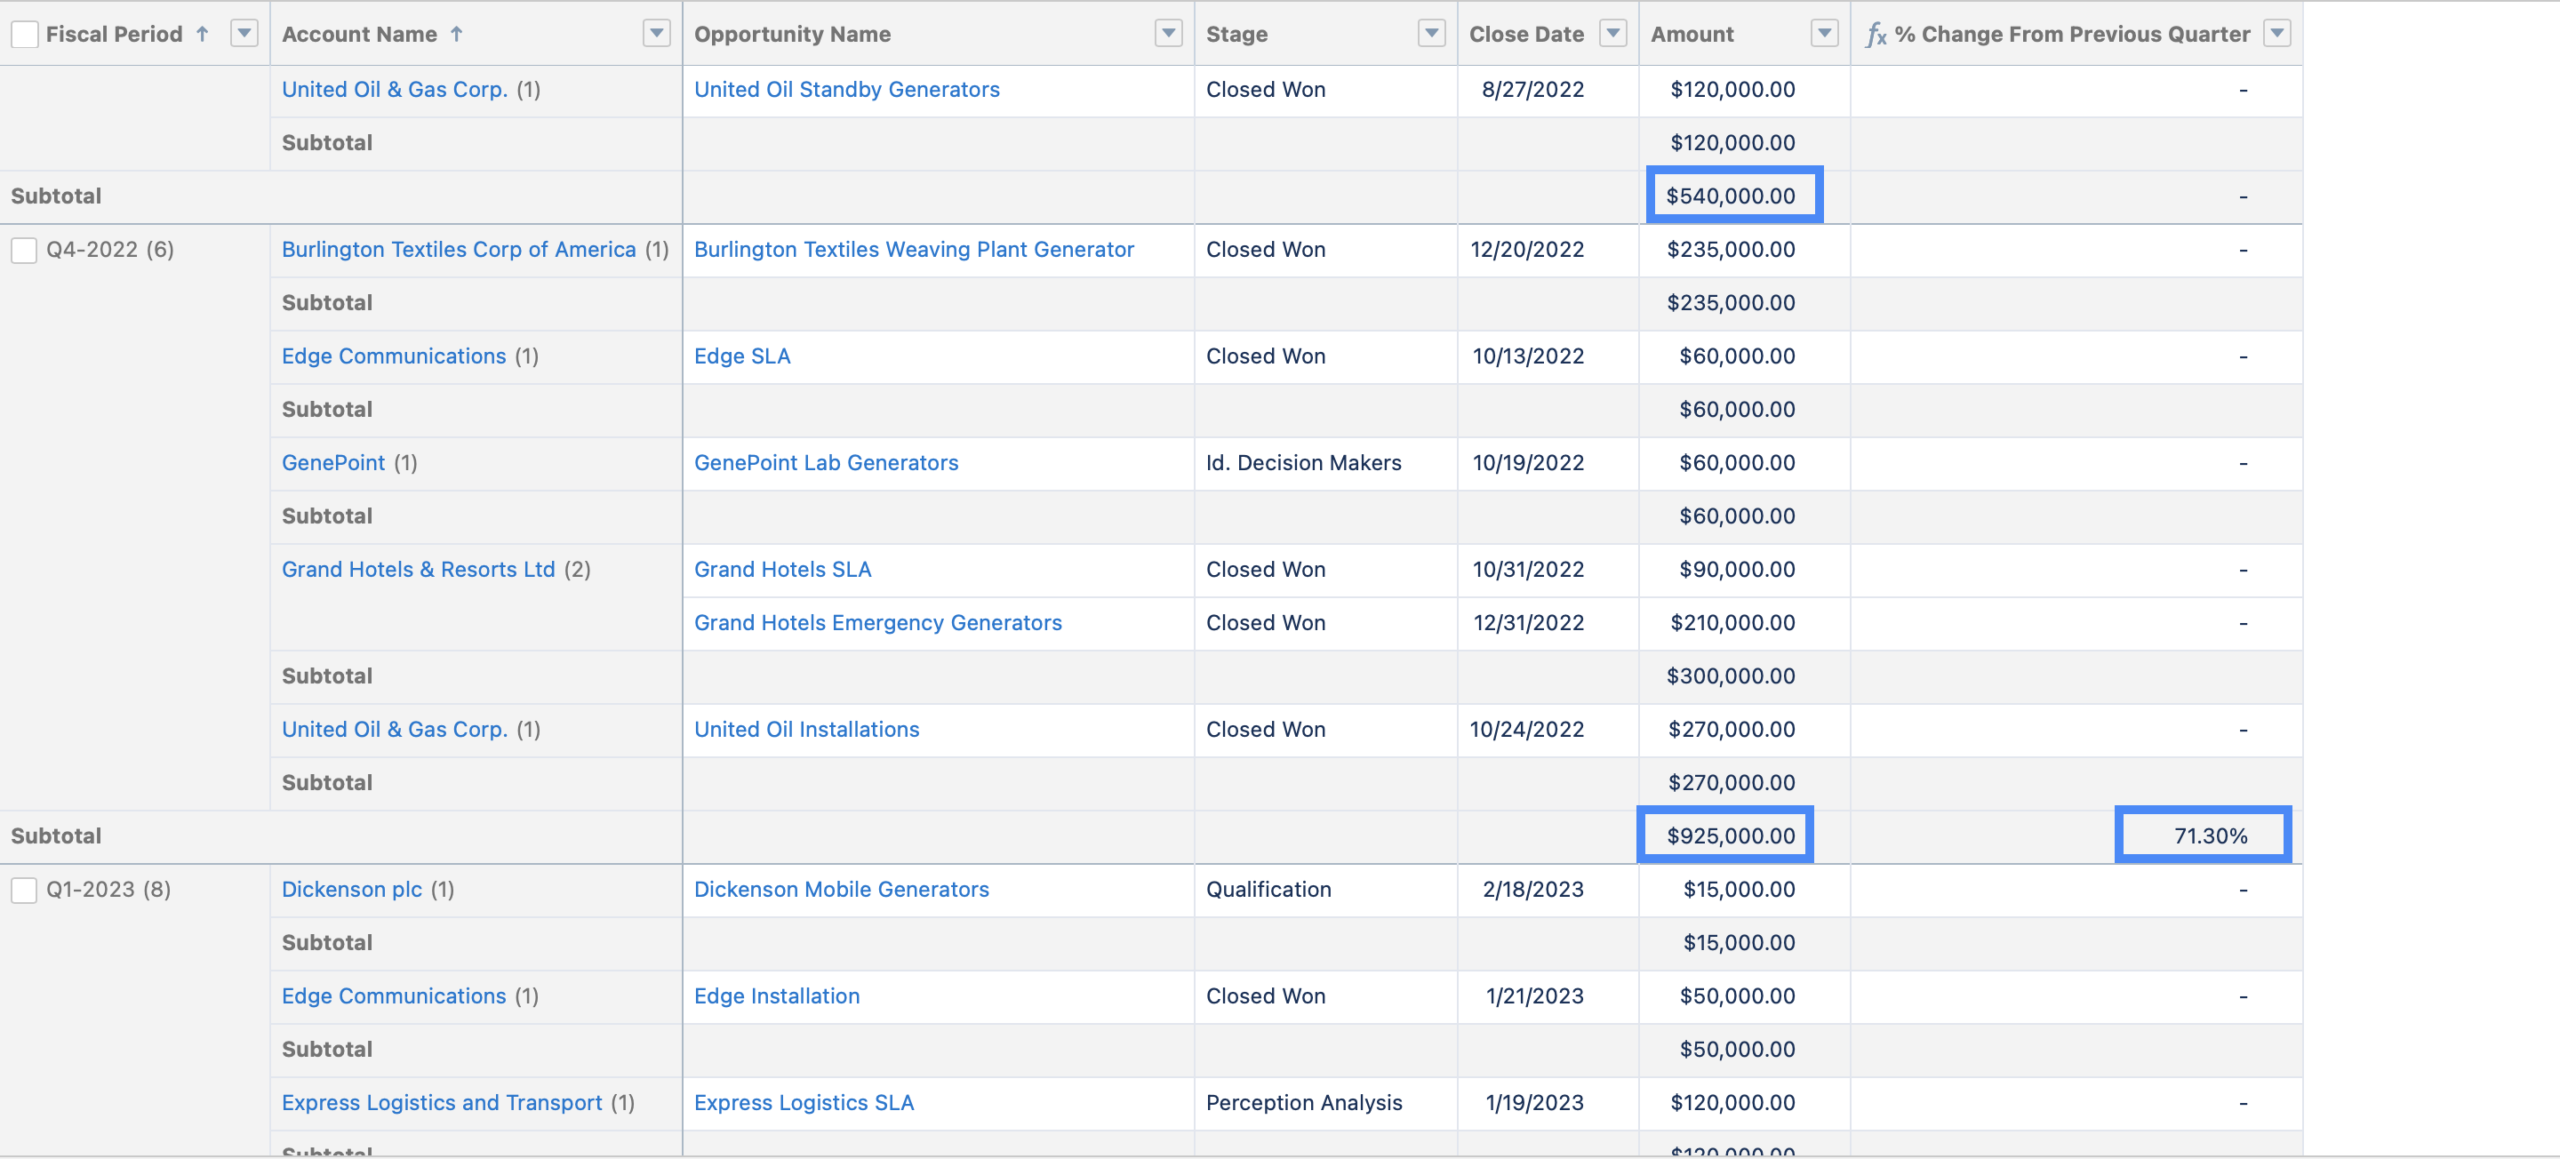
You should now see that the % Change From Last Quarter field reflects the percentage change from period to period.
We also see decreases from quarter to quarter handled intuitively:

Handling Multiple Group Rows
PREVGROUPVAL fortunately handles multiple row groupings fairly intuitively. If you have a summary formula for Fiscal Period and add another row grouping beneath it for Account Name, it handles this without issue.
The situation you do need to be mindful of is if you add a grouping level above a grouping level for an existing summary formula. This splits up your records and means that instead of your formula representing the change from 1 quarter to the next for all accounts, it would now represent the change from 1 quarter for a given account, to the next quarter for the same account:
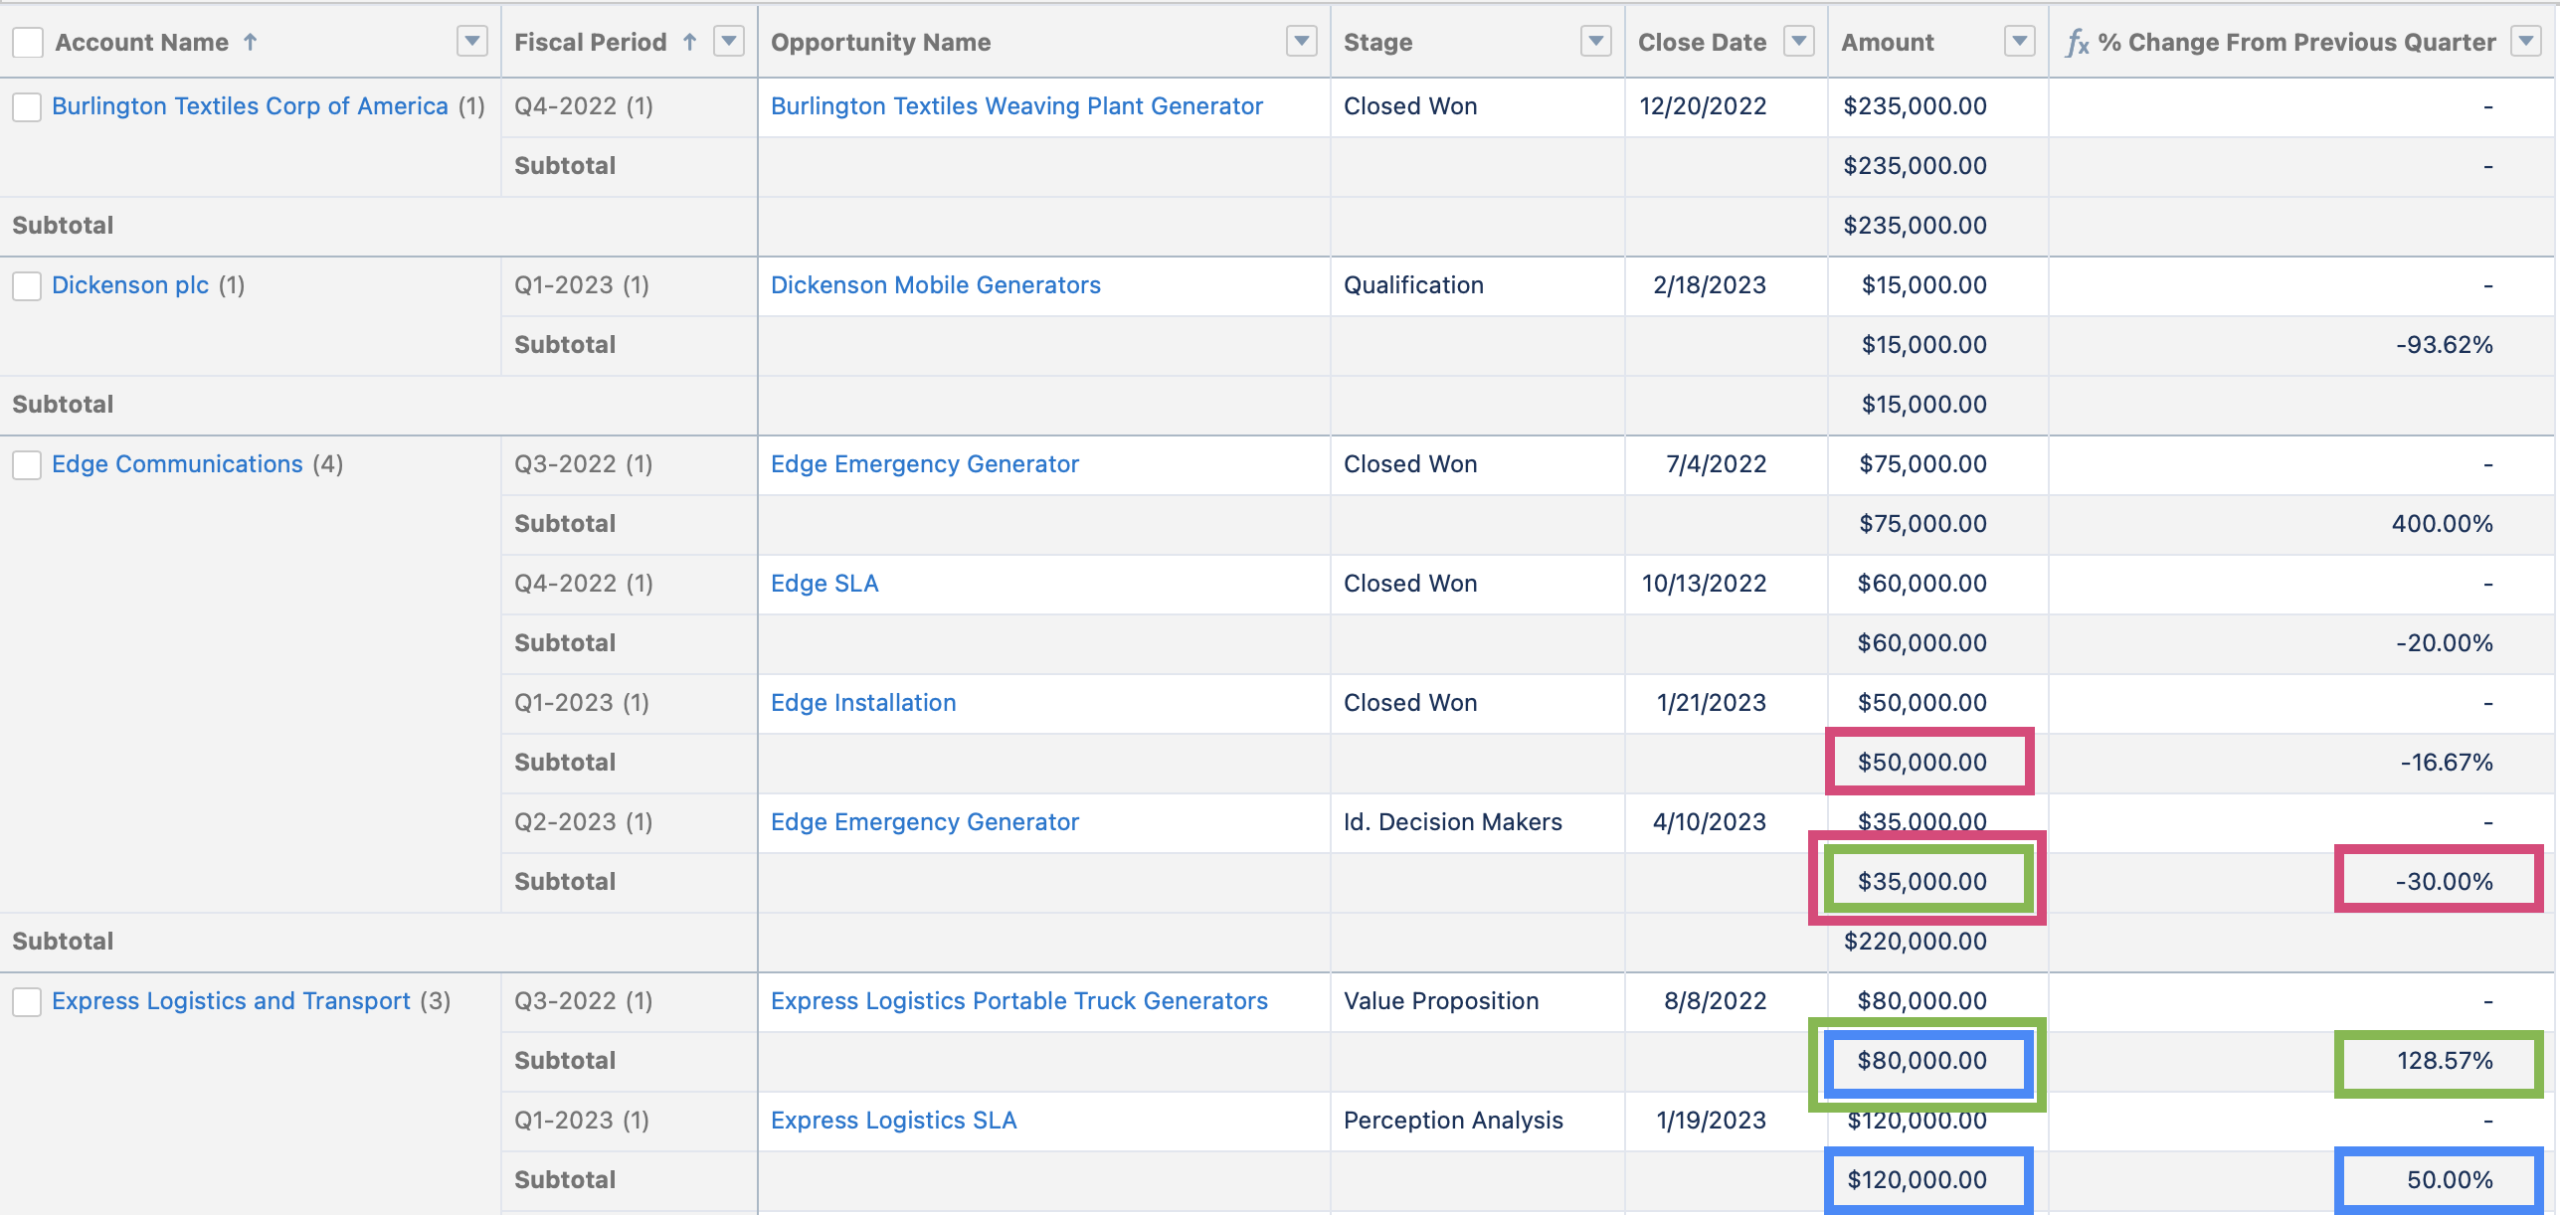
This is probably not what we want. So just be mindful that Salesforce won’t throw an error if you were to make a change like this, even though it changes the meaning of the data.
Basic PREVGROUPVAL Summary Formula (…, Matrix Report)
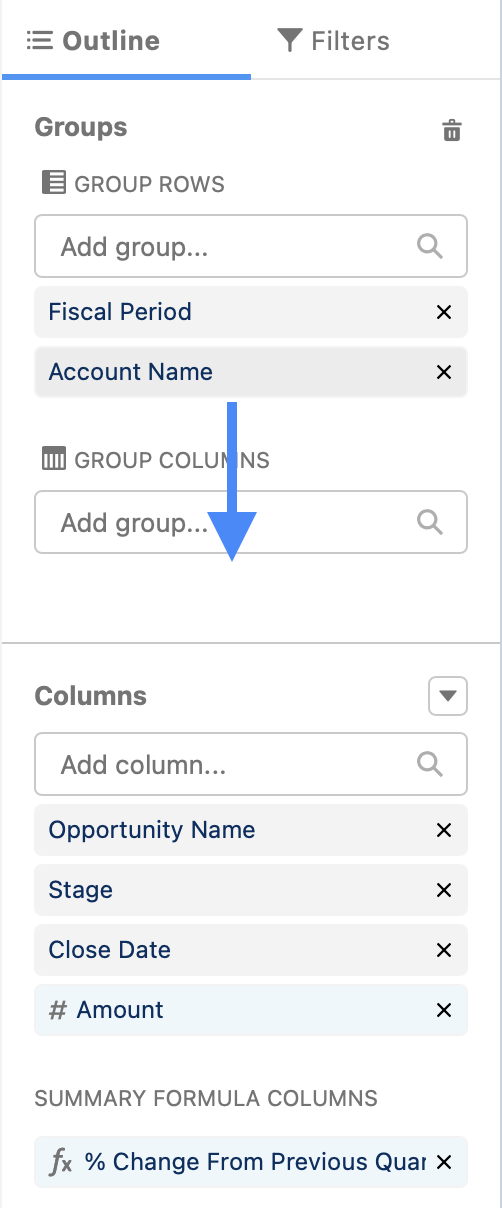
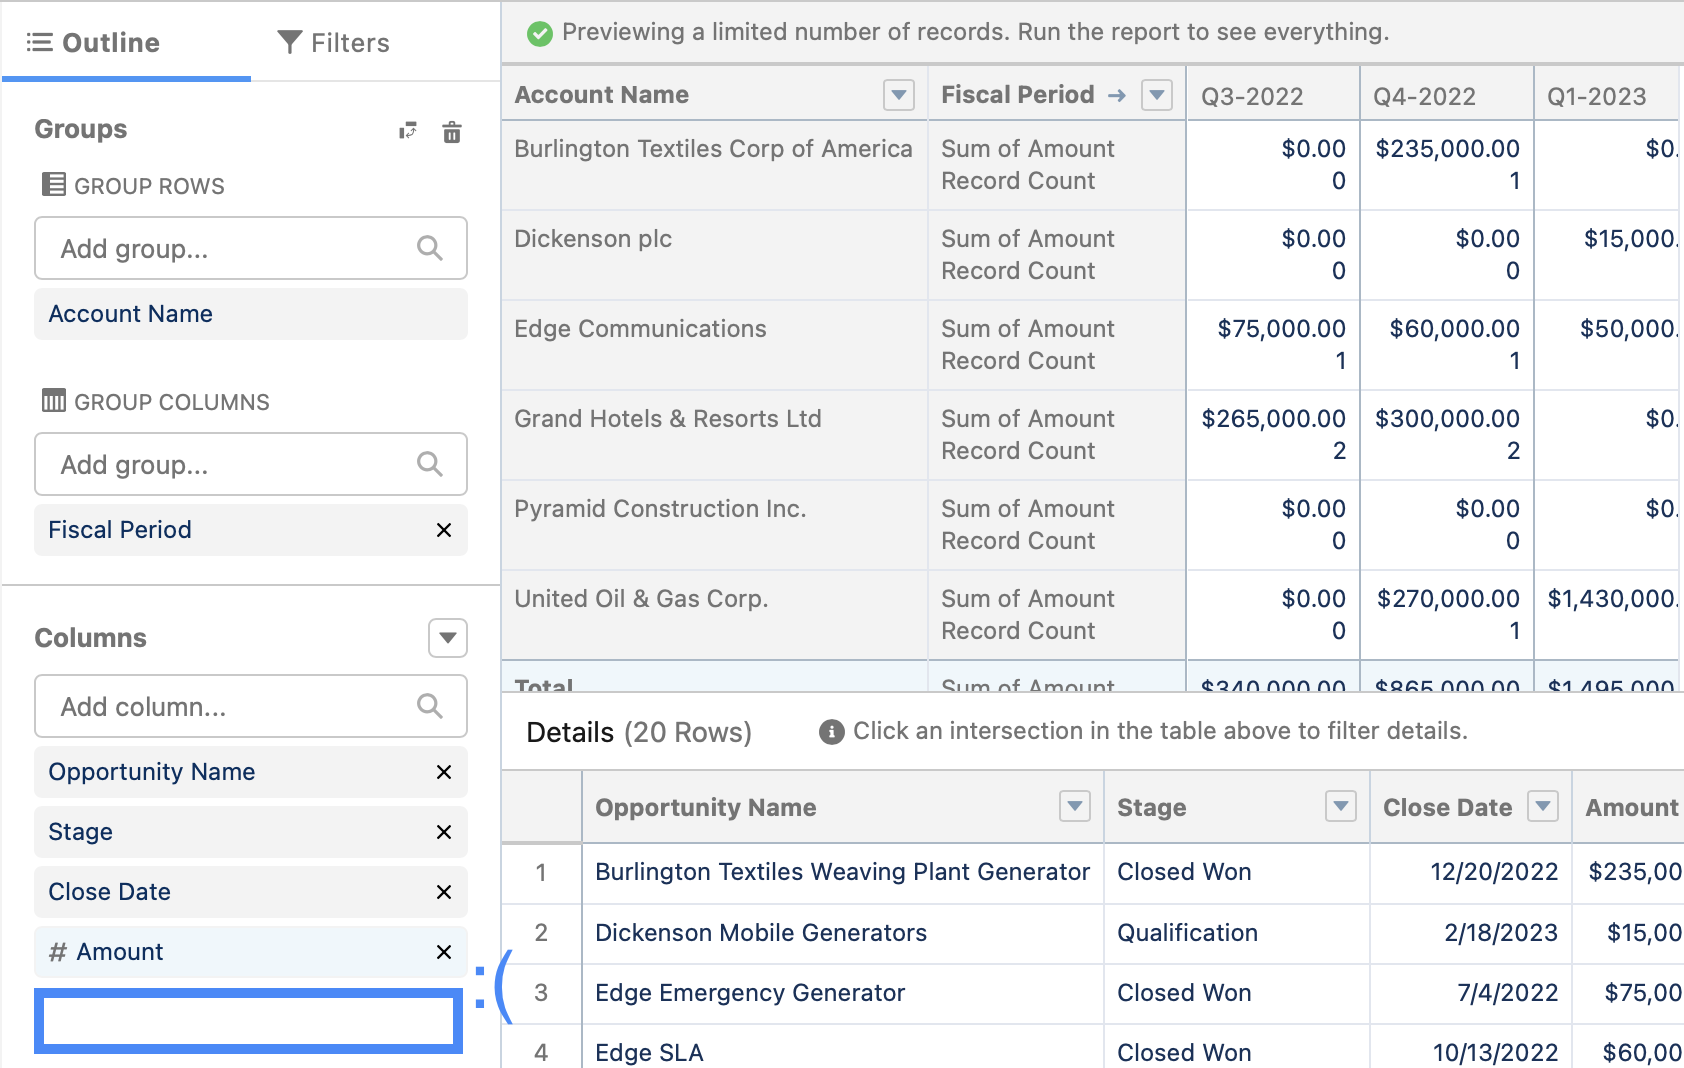
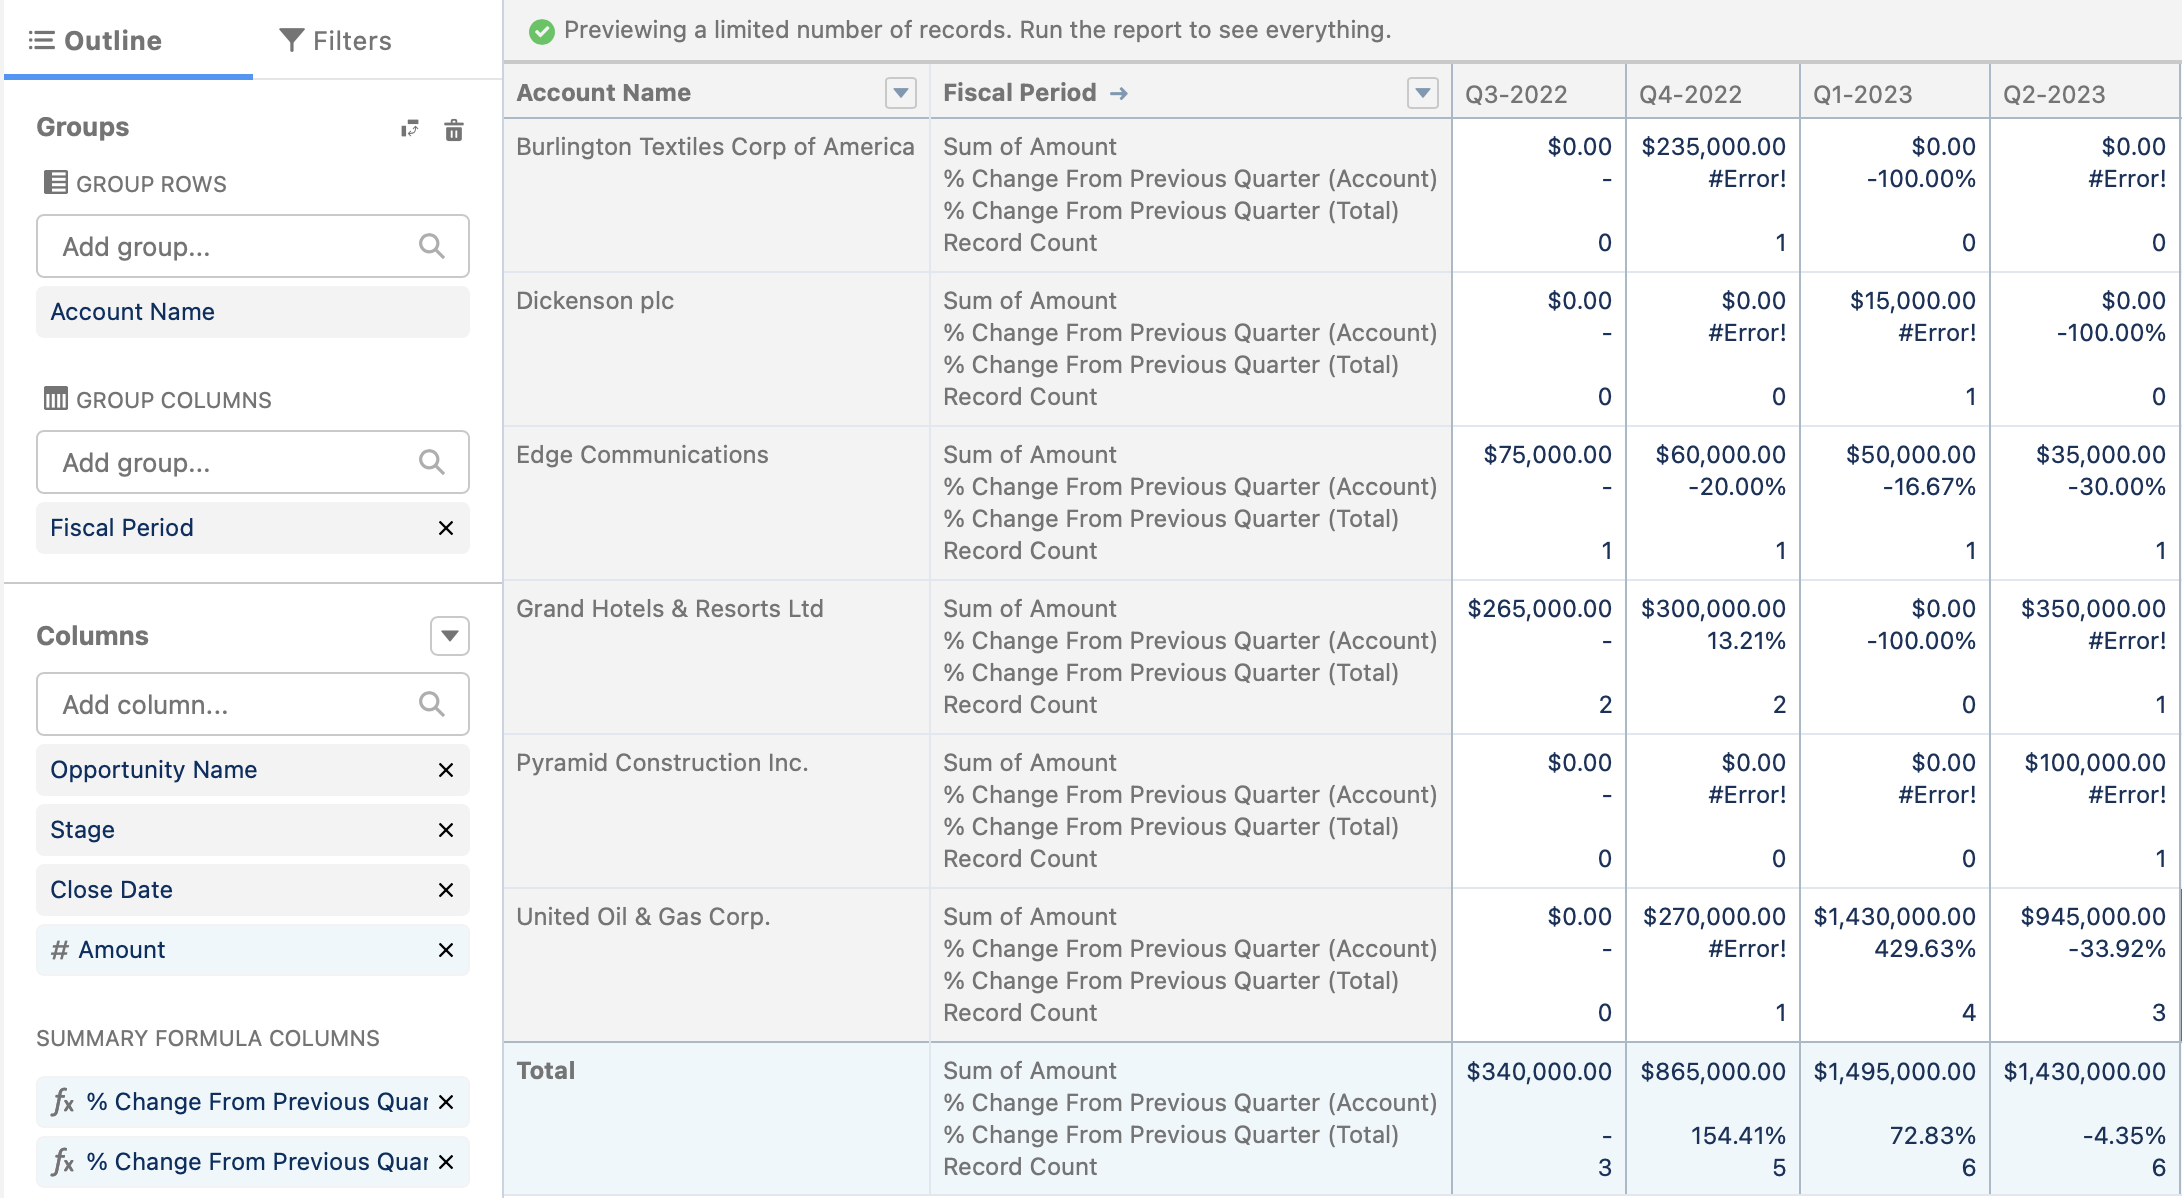
Let’s up the ante one more time and look at using PREVGROUPVAL in a Matrix report. Let’s go ahead and move Account Name down into the Group Columns:
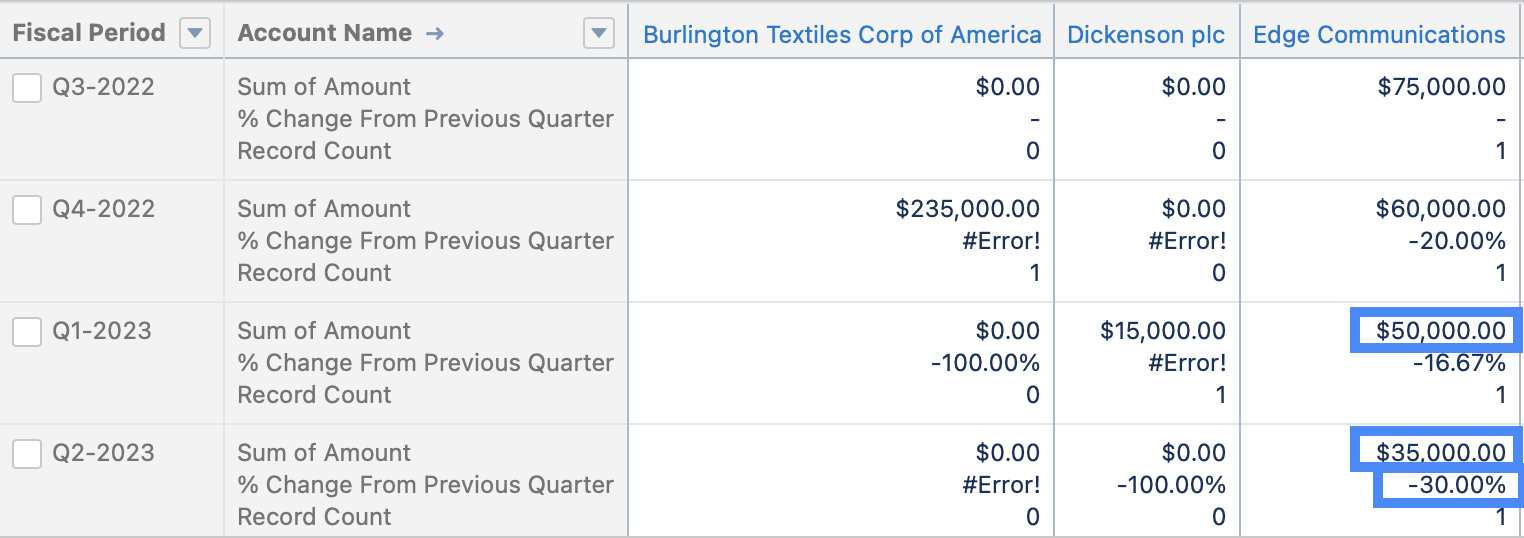
By converting this to a matrix report, we pack a LOT of data into a small space and once again our formula works! Just like in the double-group-rows example, the % Change From Previous Quarter field is demonstrating the % change for a given account instead of the quarter as a whole.:
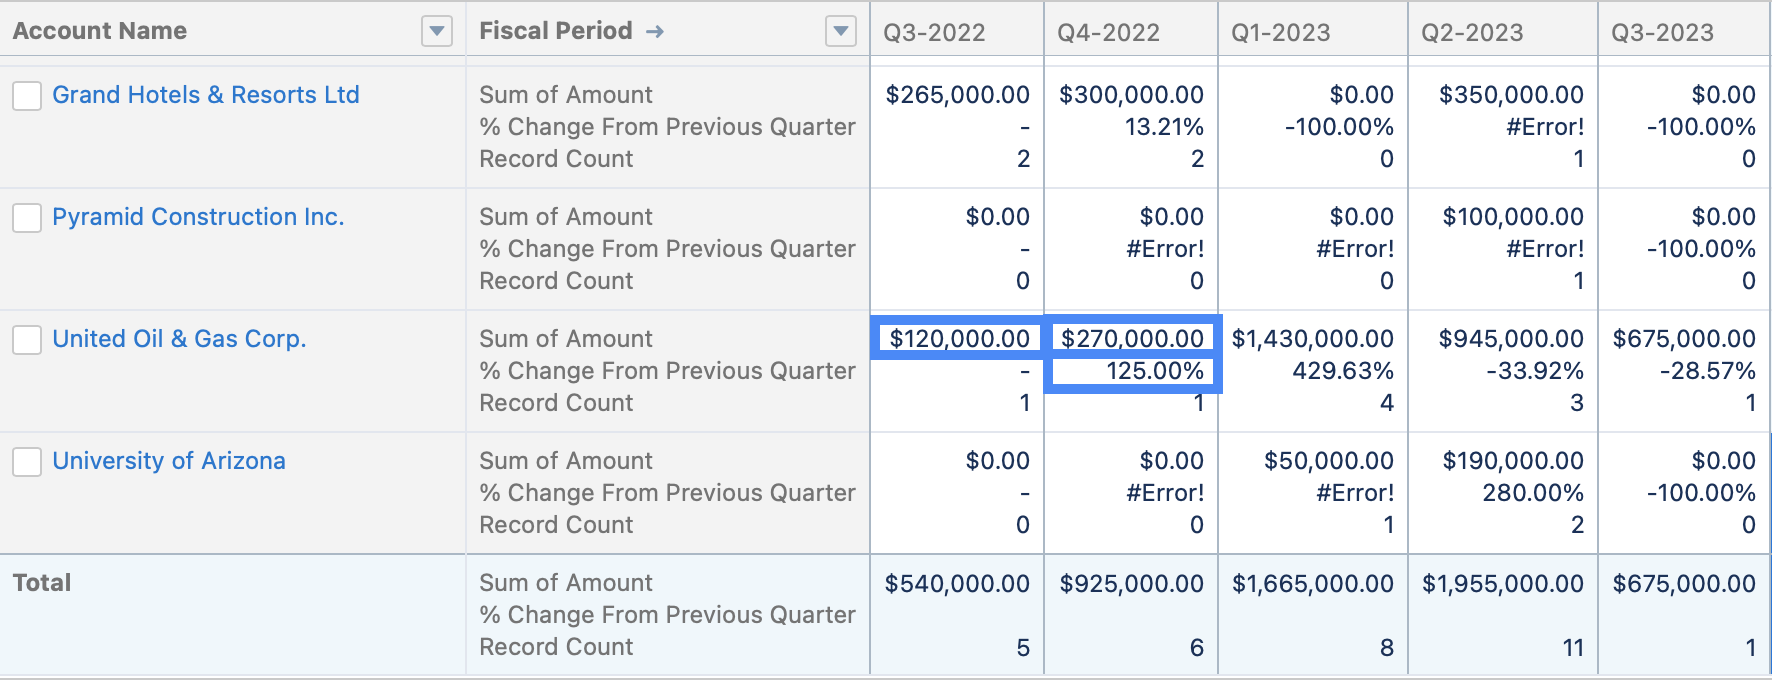
Do note however that if you move Fiscal Period down to the Group Columns section instead, that % Change From Previous Quarter disappears:
If you try to add it back, you’ll notice something different:
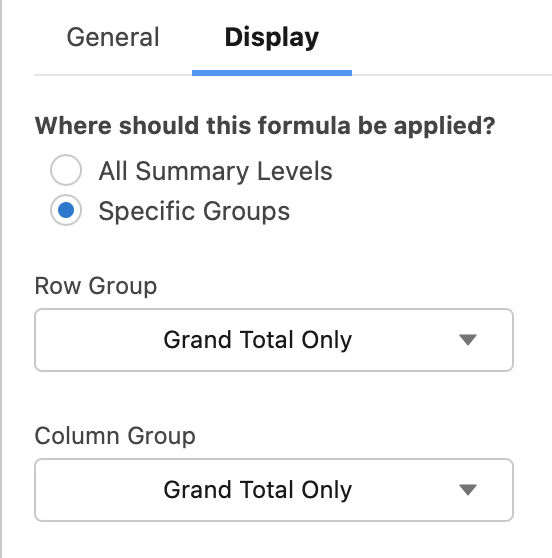
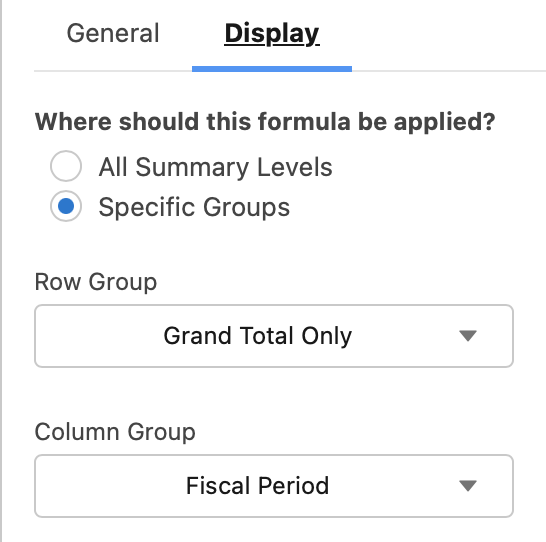
When you try to set formula groups on the Display tab, you now have options for both Row Group and Column Group. Respectively, Row Group and Column Group each only provide options for Grand Total Only and whichever fields you have in the Group Rows and Group Columns.
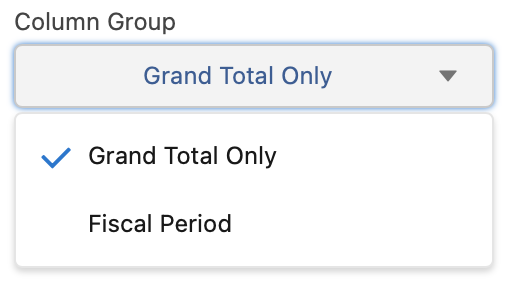
If we Select Grand Total Only for Row Group and Fiscal Period for Column Group…
… and hit apply, we get… an interesting result:
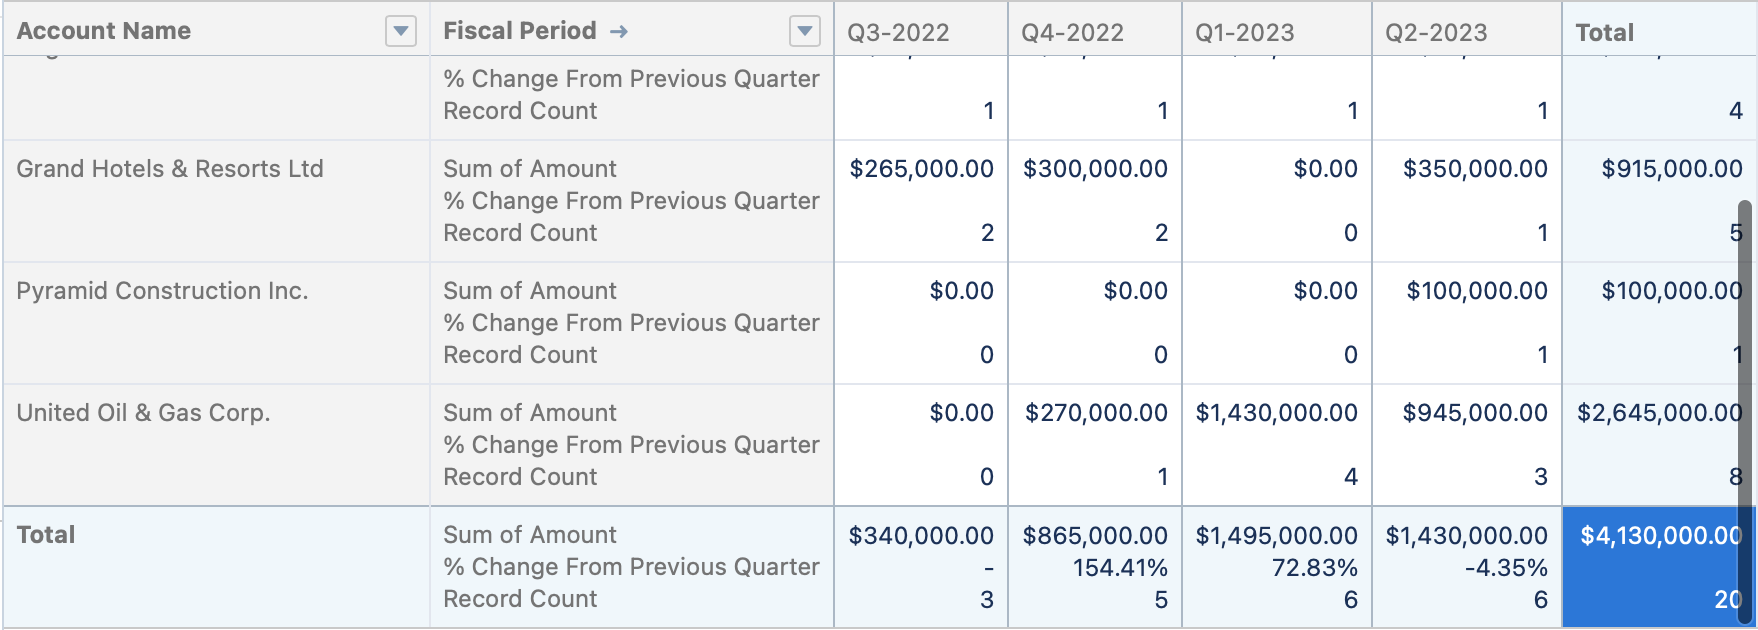
% Change From Previous Quarter is back, but only in the Total row. Notice that these results match what we were seeing in the second example, where we only had 1 grouping level, and it was telling us the % change for all accounts by quarter.
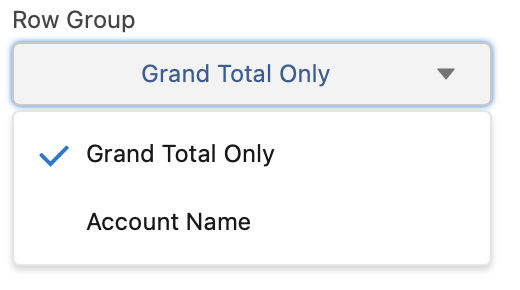
What happens if we change Row Group to Account Name?:
We’ve now lost the total-level % change, but now have % Change From Previous Quarter grouping by Account Name again.
We can actually still have both versions in the the report, we just have to create another Summary Formula Column with the same formula, but with different Row Groups (just make sure to name them intuitively)
That’s it! You now understand the core concepts around working with the PREVGROUPVAL formula in reporting. If you’d like more practice, I recommend working through this exercise on Trailhead:
Compare Groups with PREVGROUPVAL() and PARENTGROUPVAL()
or for an extra challenge, take on the Lightning Experience Reports & Dashboards Specialist Superbadge (what a mouthful!).
Lastly, if you haven’t already, check out my other article on The Basics of Using PARENTGROUPVAL.