
In my current admin role, it’s not in my job description to do reporting, but somehow I always find myself embroiled in emergency requests to draft reports for executives at my company. Maybe it’s just me, but I’ve always found the PREVGROUPVAL and PARENTGROUPVAL functions in Salesforce to be far more confusing than almost anything else. I think this comes from the weirdly sparse documentation around these two functions as the fact that their behavior is so wildly different from anything else we’re used to.
When we look at Salesforce’s documentation for these functions, it’s… rough… They give you a high-level explanation of how the functions work, but don’t give you much in the way of how to use them beyond a simple example:
PARENTGROUPVAL and PREVGROUPVAL on Salesforce Help
In addition to this, they allude that there is a 3rd grouping level that has to be applied on matrix reports, but then don’t tell you much about what’s actually supposed to go there. So let’s try to answer that question and break down some examples. For this to make sense, we need to try to understand how summary formulas work, since that’s how we get our column groupings. Let’s do that first!
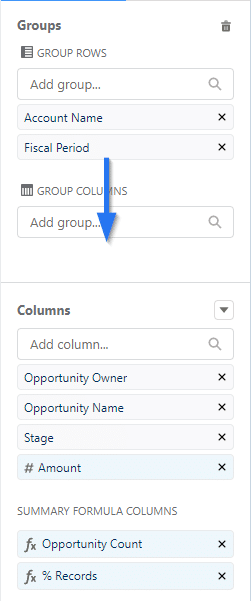
Basic Summary Formula (Count Records in a Group)
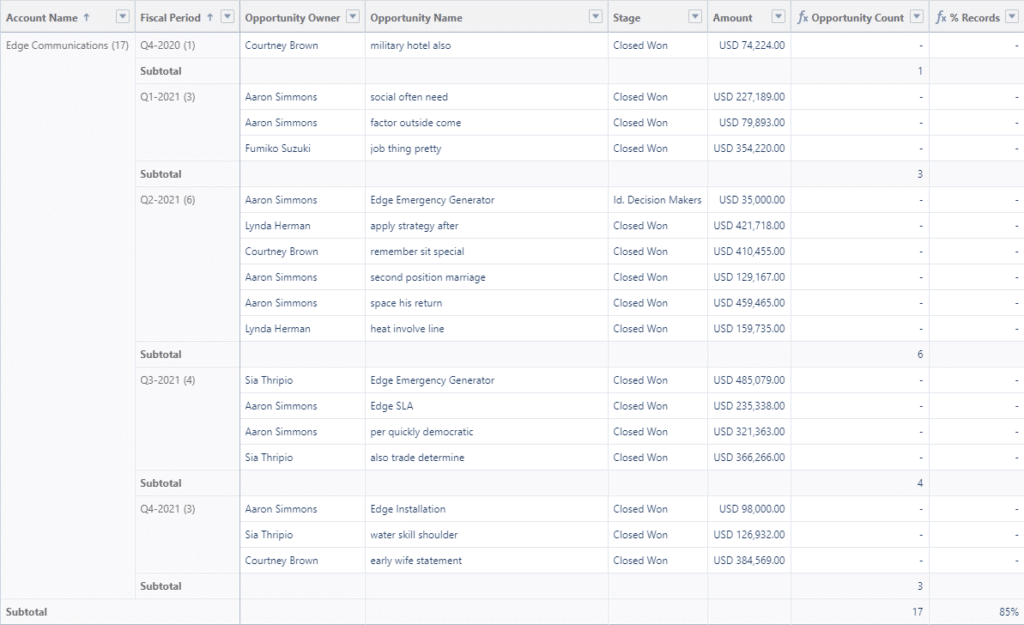
First, let’s start with a very basic Opportunity Report, with a configuration like this:
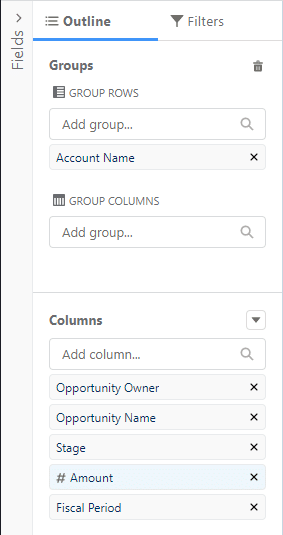
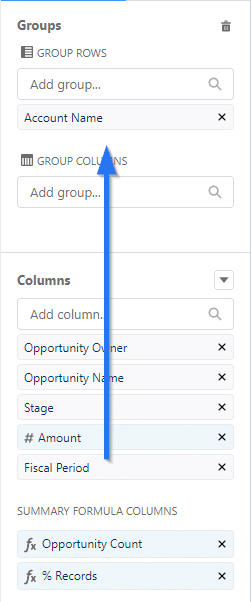
Columns: Opportunity Owner, Opportunity Name, Stage, Amount, Fiscal Period
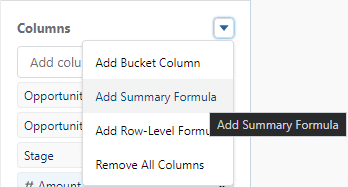
Then we’ll create a Summary Formula.
Click the Caret next to Columns, then click Add Summary Formula
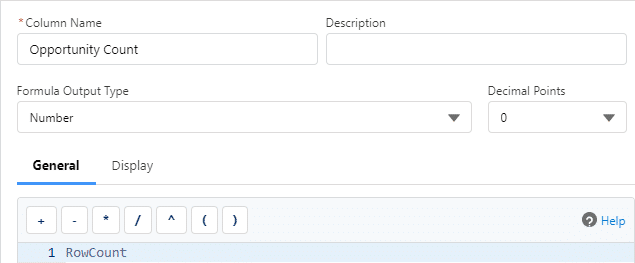
Next, let’s name our column Row Count, set the output type to Number, and Decimal Points to 0.
For the Formula, just put RowCount, then Click Apply.
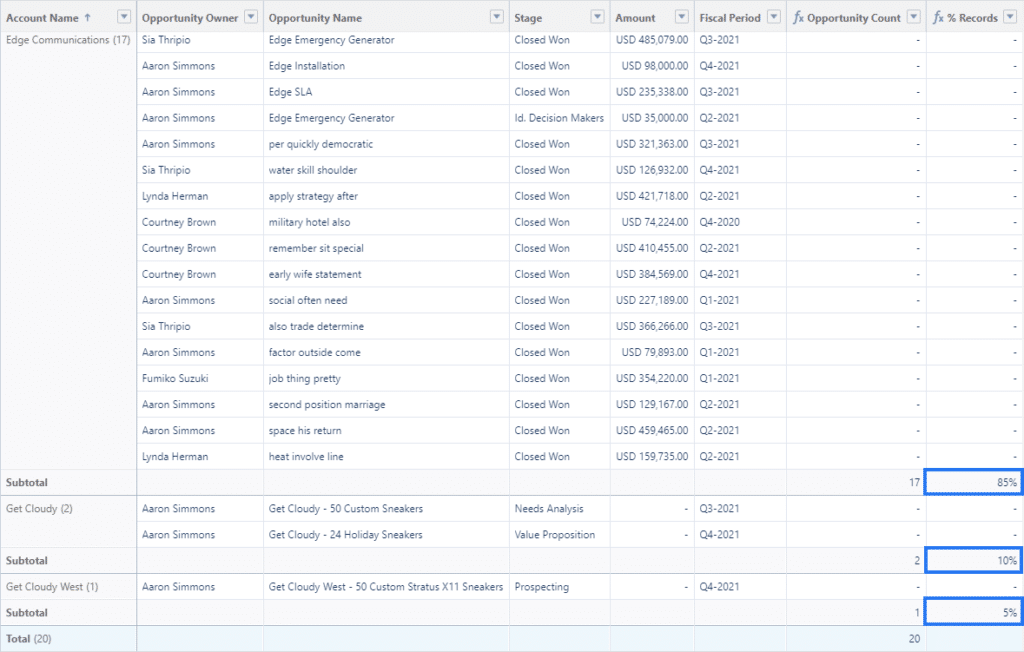
That will give you a page that looks something like this:
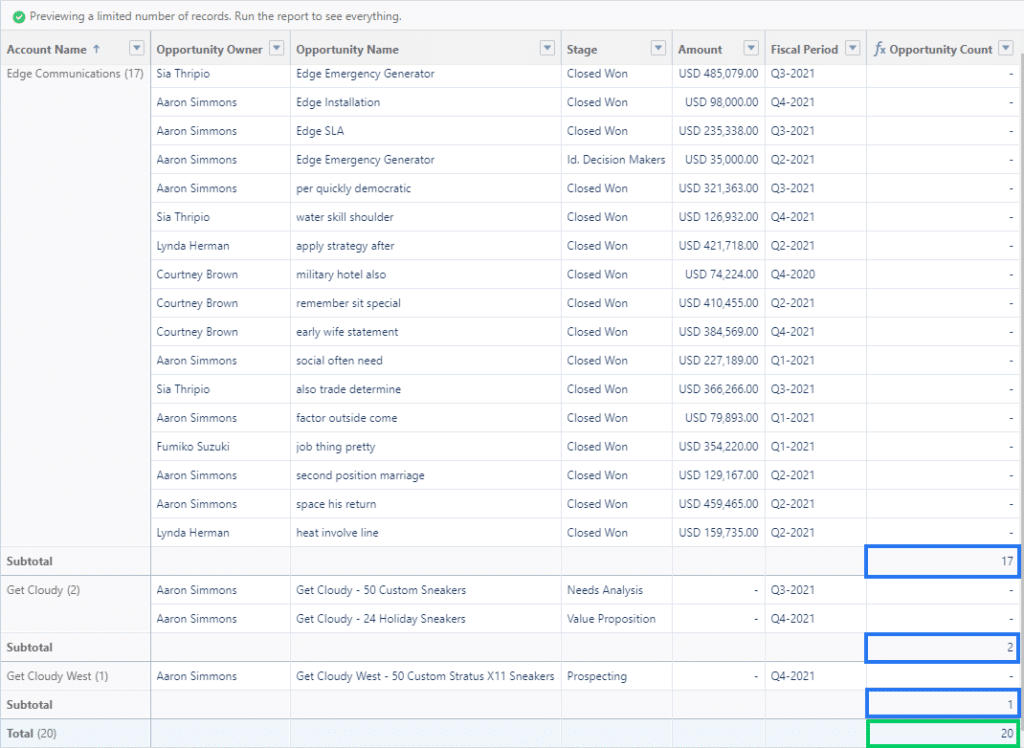
You’ll now have your new Opportunity Count column, and on the Subtotal Rows for Account Name (our group column), you’ll have the number of records within each grouping, as well as the total number of records in the report in the Total Row (or Grand Total)
This takes us to an important facet of summary formulas. You can choose which groups they apply to, as well as whether it should be calculated for the Grand Total. This becomes important once we try to do something like calculate the percentage of Opportunities held by each Account. In fact… let’s do that!
Basic PARENTGROUPVAL Summary Formula (% Records in Group vs Total, Summary Report)
We’ll add a new summary formula that looks like this:
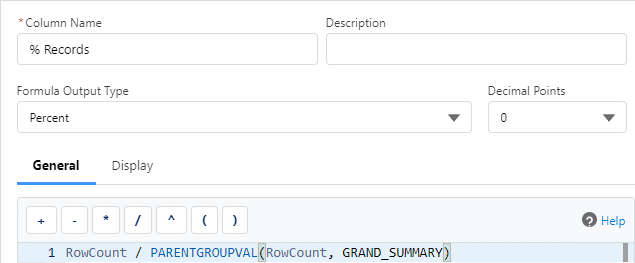
We’re setting the Column Name to % Records, a Formula Output Type of Percent, and 0 Decimal Points.
For the Formula, we’re going to use:
RowCount / PARENTGROUPVAL(RowCount, GRAND_SUMMARY)This is taking the total count of the rows in each group, and dividing it by the row count at the Grand Total level.
When you try to hit save, you’ll probably see this warning now:

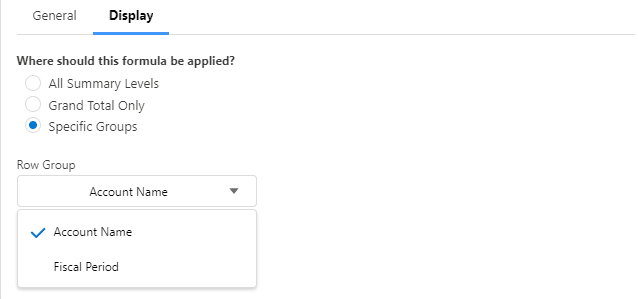
To fix this, go into the Display tab, set the formula to apply to Specific Groups, and then in this case, Row Group should automatically be set to Account Name
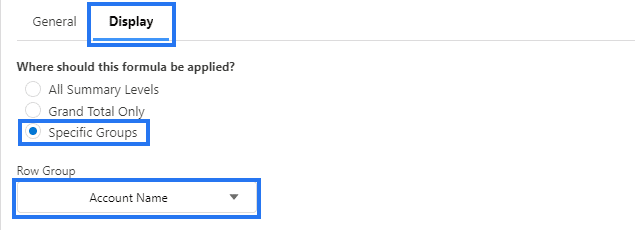
Now we can click apply.
Looking back, that requirement kind of makes sense. If we tried to do this calculation at the Grand total level, we’d get 100%, so it wouldn’t tell us much. Let’s make this more difficult though and turn this into a matrix report to really show off how these summary formulas work, as well as PARENTGROUPVAL.
Basic PARENTGROUPVAL Summary Formula (% Records in Group vs Total, Double-Summary Rows Report)
So what happens when we use two different grouping levels? Now we have to chose which groupings our column will apply to. To test this out, let’s move Fiscal Period into the Group Rows under Account Name.
That gives us a report that looks something like this:
Notice that the summary formulas still apply! Let’s re-open % Records and go back to the Display tab.
We now have two options for our Row Group— one for each of our group rows.
Let’s take a look at both to compare them:
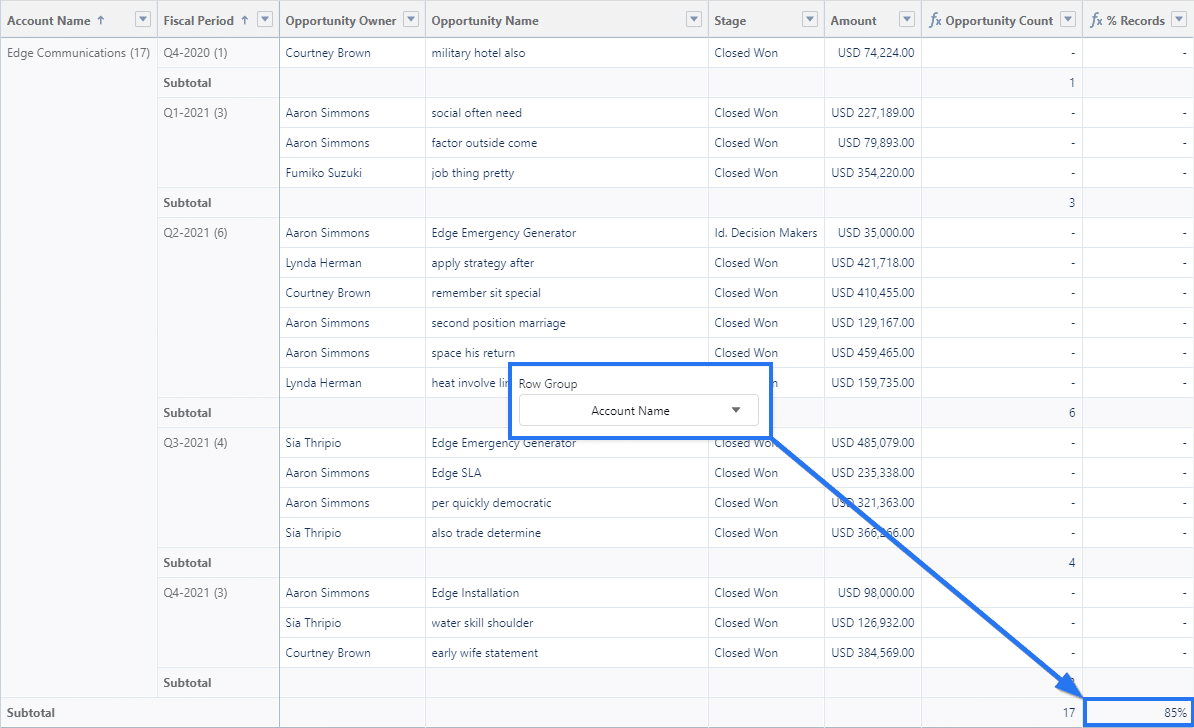
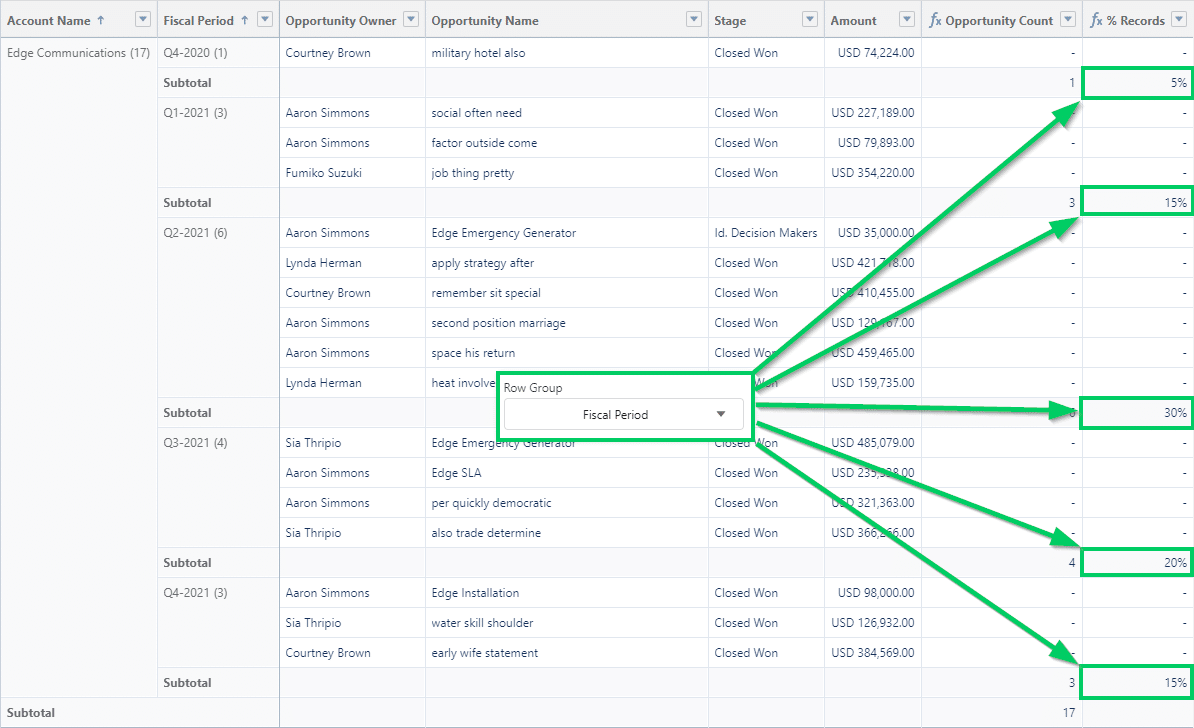
You can see above how our percentage calculation changes depending on which group we select. You’ll also notice that Opportunity Count doesn’t seem to care which is selected because we previously selected All Summary Levels for that summary field.
Now that we can see how those summary levels work, let’s go bigger and apply this to a matrix report.
Basic PARENTGROUPVAL Summary Formula (% Records in Group vs Total, Matrix Report)
If you’re still following along from above, let’s turn this into a matrix report by moving Fiscal Period down into the Group Columns.
When you try to make this change, you’ll get an error like this:

This is because your PARENTGROUPVAL function now requires you to also choose which column grouping it should use. This is unfortunately not well documented. The documentation linked above shows that it’s needed, but doesn’t tell you what goes there. Let’s fix that:
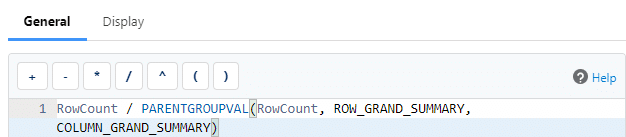
First, we need to update the PARENTGROUPVAL formula to use ROW_GRAND_SUMMARY and COLUMN_GRAND_SUMMARY (These are not in the Salesforce documentation at time of writing):
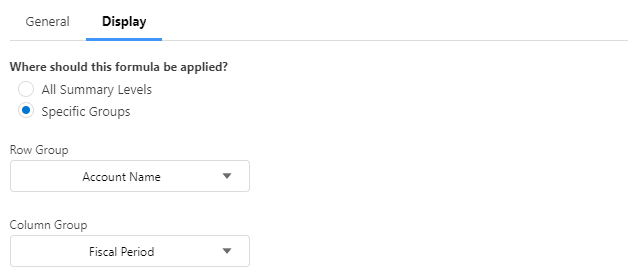
RowCount / PARENTGROUPVAL(RowCount, ROW_GRAND_SUMMARY, COLUMN_GRAND_SUMMARY)Next, we need to go into the Display tab and set our Row Group and Column Group. We’ll set Row Group to Account Name and Column Group to Fiscal Period
Now let’s hit Apply.
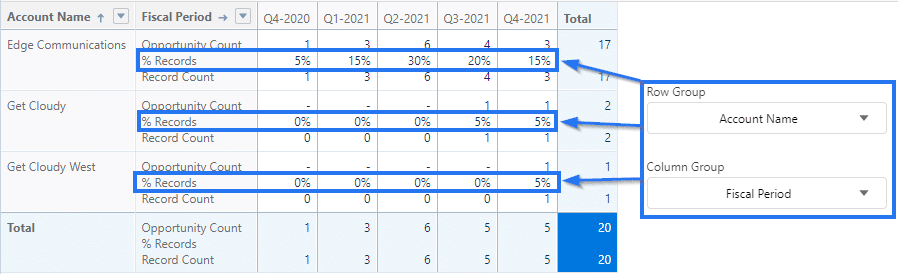
This gave us a breakdown of the percentage of opportunities within each account, per each quarter.
Let’s look at the other options:
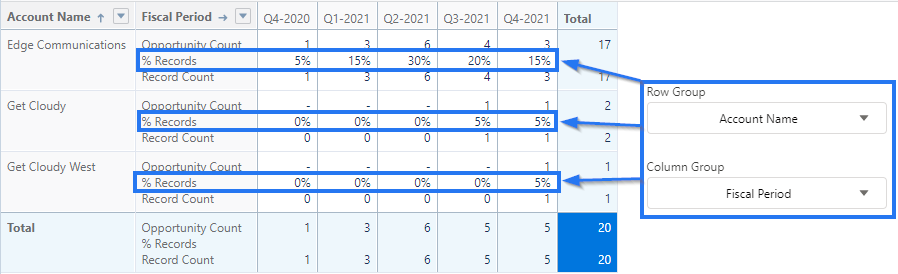
Row Group: Account Name, Column Group: Fiscal Period (% Records Per Account Per Quarter) 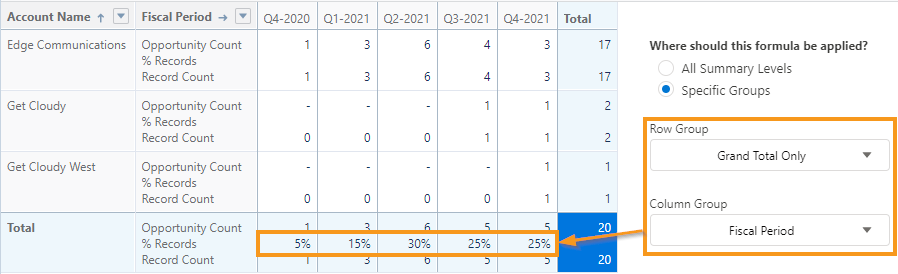
Row Group: Grand Total, Column Group: Fiscal Period (% Records Per Quarter) 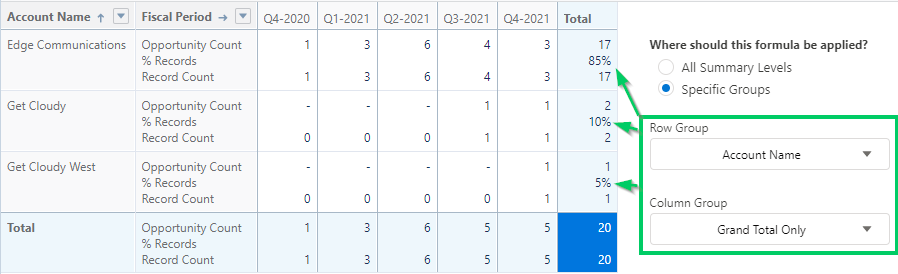
Row Group: Account Name, Column Group: Grand Total (% Records Per Account) 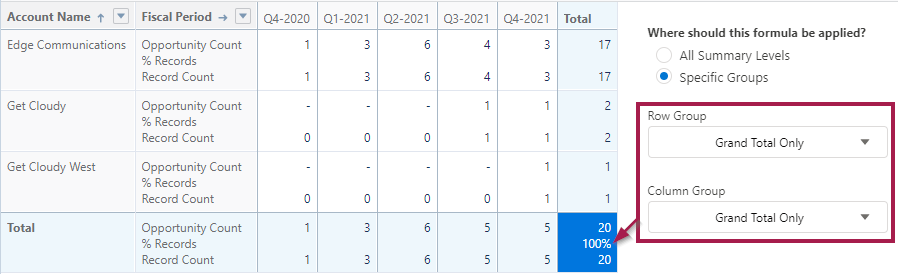
Row Group: Grand Total, Column Group: Grand Total (% Records Per… Table?)
As you can see, the double-Grand Total option isn’t particularly useful, but the other options, which summarize by Account, by Fiscal Quarter, and by both can provide a valuable breakdown of our Opportunity data.
Those are the basics on how summary formulas and PARENTGROUPVAL work. In another post, we’ll break open some more of the possibilities with the function, complete with more examples and use-cases!
In the meantime, try it out yourself with this exercise on Trailhead!:
Compare Groups with PREVGROUPVAL() and PARENTGROUPVAL()
or for an extra challenge, take on the Lightning Experience Reports & Dashboards Specialist Superbadge.
Thanks so much for this, it’s wild that Salesforce don’t explain all of the potential options for a particular function (even more than 2 years after you wrote this!)
For some reason I had to specify the field name for the row group in a Matrix report, so my summary formula looks like:
RowCount / PARENTGROUPVAL(RowCount, Contact.Year_of_Graduation__c, COLUMN_GRAND_SUMMARY)
Hello there I am so thrilled I found your blog, I really found you by mistake, while I was looking on Bing
for something else, Anyhow I am here now and would just like to say cheers for a
marvelous post and a all round exciting blog (I
also love the theme/design), I don’t have time to read it all
at the moment but I have book-marked it and also included your RSS feeds, so when I have time I
will be back to read much more, Please do keep up the fantastic
work.
What if I have a report that is already giving me the sum of opportunities for accounts with columns by year (2021 & 2022). I’d like to see the percent change with an additional column. Is there a good solution here that I could use?
Hey Adam, I posted a new article explaining how to do this using PREVGROUPVAL. Hope that helps!
https://playful-moose.com/the-basics-of-using-prevgroupval/
This has been the EASIEST instruction I’ve found for a quick start on PARENTGROUPVAL.
Thank you! This is the best explanation of using the PARENTGROUPVAL function that I have come across yet. Can you use this function to calculate the percentage of each row value to the row grand total?
If you’re looking to capture the percentage of total for a given group, that’s fairly straightforward. For example I can use this formula in a summary formula in the same report as above to get the percentage of total sales amount for a given grouping:
AMOUNT:SUM / PARENTGROUPVAL(AMOUNT:SUM, GRAND_SUMMARY)If we’re trying to get the percentage for each row, it’s strangely more difficult since row-level formulas don’t let us use PARENTGROUPVAL in our formulas.
The simplest way that we can get there is to group by the Opportunity Name (assuming that you name them uniquely in your org)…

… and then you can use the same summary formula and just change the row group to Opportunity Name on the display tab of the Row Summary Formula editor.

Hope that helps!